Average?
The global average temperature, presumably accurately calculated in the same way for the last 140 years (otherwise it is not very scientific, see below), is a measure of thermal energy storage—that is what temperature is a measure of. Addressing the specific heat capacity of the various molecules is the correct method of ascertaining their independent effects upon temperature.
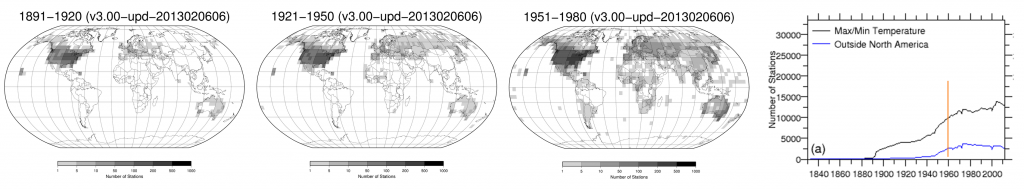
The maps above from images supplied by NOAA shows the number of weather stations beginning in 1891, through 1980, and on the right shows those numbers in a chart. The orange line on the right shows where approximately our societies can begin to even use “global temperature data”, because the data was not consistently generated, from enough disparate and truly global sources, before about 1960.
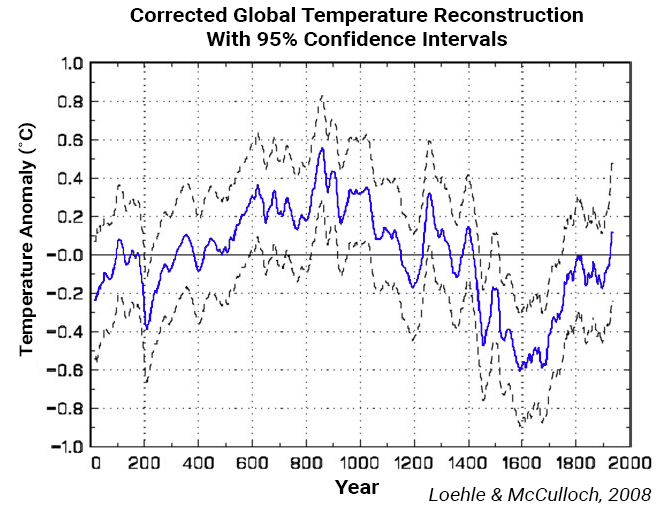
Scientists have also devised proxies of temperatures, from many sources, including Greenland Ice Core Project borehole temperatures, pollen studies, sea sediments, diatoms, speleothem data from caves, stalagmite oxygen isotopes, etc., in total 18 series of disparate data sources with wide geographical coverage, as shown in a well-known chart of temperature proxy estimations for the last 2,000 years, below. This proxy data does not show warming, in spite of media coverage to the contrary.
Please enter your email so that we can update you when the new book is out, and to download the free paper:
Note the outstanding peer reviews below, presented anonymously, which you are also encouraged to do to [email protected] in the present politically-charged “climate” of climate science.
"You have found a promising approach to demonstrate successfully that the long suspected culprits of global warming, e.g. CO2, CH4, are actually not !"
PhD, Physics
Rutgers University, New Jersey
B.A. Cornell University, New York
"…seems to be path-breaking research in the domain. The paper reads nice and the science involved is analogous and clear. This paper is a hallmark and would benefit the advances in science, government planning as well as policy makers for the next course of action. I congratulate you for this great work and thank for giving me an opportunity to read it and enlighten myself."
PhD, Atmospheric Sci and Meteorology, IISc
M.Sc., Geophysics, ISC
BSc., (Hons) Physics, Delhi U
"An alarmist bias in Global Warming Research has corrupted the academic/scientific community"
Dr. Roy W. Spencer
Ph.D. Meteorology
University of Wisconsin-Madison.
Principal Research Scientist at UoA
Former Senior Scientist for Climate Studies at NASA’s Marshall Space Flight Center
"I have studied your paper during the weekend and I am impressed by your brilliant analysis and convincing argumentation. This looks like a very original thought process and one that does deserve broad dissemination."
B.Sc. (Hons) Mech. Eng.
DTU, Denmark
C.P. Eng. (Chartered Prof. Eng.)
Former Project Manager, CERN
Geneva, Switzerland
You will only receive quality content.