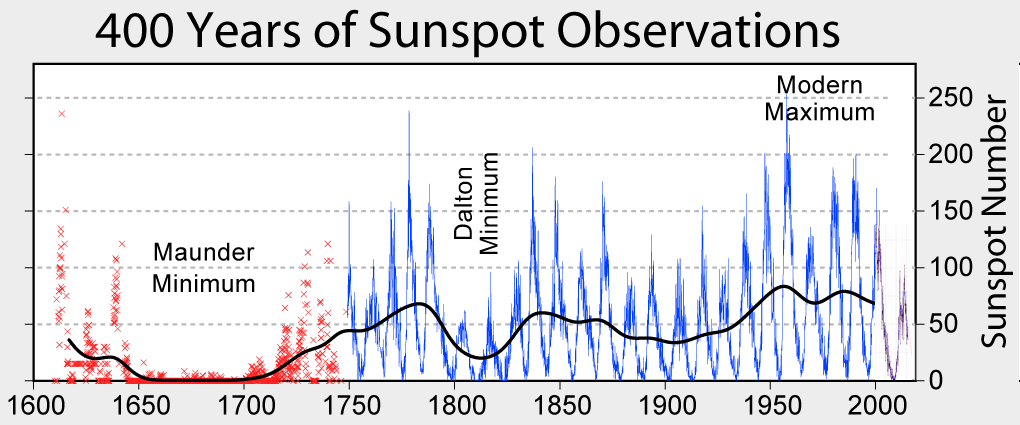
The above chart suggests the question: “Do sunspots provide us information that can help us ascertain the Sun’s changes that alter the Earth’s climate?”. In the above chart at the right, we see a decline, as if there were an emerging Grand Solar Minimum, which happened in cooler times in the past, such as the Maunder Minimum above. Some scientists have found a basis for the sunspot number in magnetic field cycles, and research and verification in this area is underway.
But presently there is a concern that the Sun’s activity, as measured by sunspots, affects the Earth considerably.
“While the Sun provides for us, it is also capable of taking away. The weather and climatic scales of solar evolution and the Sun-Earth connection are not well understood.”
There are three principle ideas here: the first is that a decline in solar activity reduces total irradiance on the Earth, which is found to have a minor correlation. The second and of more significance is that a decline in solar activity reduces ultraviolet photon radiation, which are the highest energy photons, and this could affect temperature changes on Earth.
Third, and perhaps the most influential, is that reduced solar activity, demonstrated by fewer sunspots, also correlates with less solar flares that reach the Earth. Since the solar flares shield the planet from cosmic radiation (coming from the Milky Way and other parts of the universe), which is significant, and these cosmic rays ionize water molecules, making them attract one another, we can infer that with fewer sunspots there will be more cloud cover. More cloud cover causes more reflection of solar radiation, cooling the Earth, and more clouds produce more precipitation.
1 High Altitude Observatory, National Center for Atmospheric Research, Boulder, CO, USA
2 Department of Physics, Montana State University, Bozeman, MT, USA
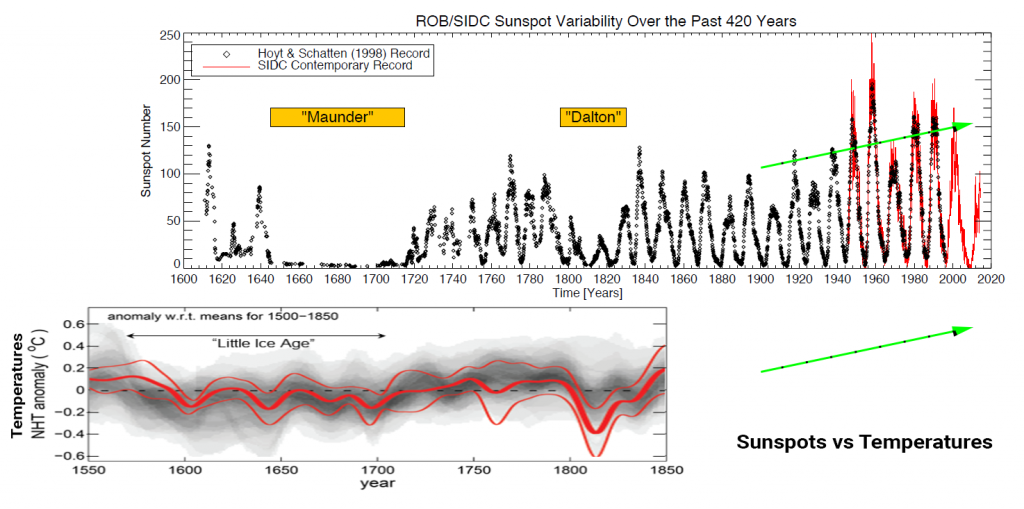
The charts below explain the present concern. Sunspot activity has been recorded accurately since the 17th century, as the top chart shows. The temperature plot on the lower left (aligned on year with the top chart) shows anomalies, or variations from a mean, and shows a clear correlation with solar activity and temperatures. This data correspondence, along with the causal understanding above, has motivated scientists at NASA, in Belgium and elsewhere to try and predict future sunspot activity.

If sunspot activity decreases, will temperatures on Earth decline? That is the question.
There is a clear correspondence shown by the green arrows on the right, above, when sunspot numbers have increased, temperatures on Earth have increased. If sunspot numbers now decline, as expected, and if temperatures decline, then there will be a causally correlated confirmation.
NASA has confirmed that:
“The forecast for the next solar cycle says it will be the weakest of the last 200 years. The maximum of this next cycle – measured in terms of sunspot number, a standard measure of solar activity level – could be 30 to 50% lower than the most recent one. The results show that the next cycle will start in 2020 and reach its maximum in 2025.”
NASA, June 2019
A good video by NASA on the Sun’s influence on the Earth is here.
Please enter your email so that we can update you when the new book is out, and to download the free paper:
Note the outstanding peer reviews below, presented anonymously, which you are also encouraged to do to [email protected] in the present politically-charged “climate” of climate science.
"You have found a promising approach to demonstrate successfully that the long suspected culprits of global warming, e.g. CO2, CH4, are actually not !"
PhD, Physics
Rutgers University, New Jersey
B.A. Cornell University, New York
"…seems to be path-breaking research in the domain. The paper reads nice and the science involved is analogous and clear. This paper is a hallmark and would benefit the advances in science, government planning as well as policy makers for the next course of action. I congratulate you for this great work and thank for giving me an opportunity to read it and enlighten myself."
PhD, Atmospheric Sci and Meteorology, IISc
M.Sc., Geophysics, ISC
BSc., (Hons) Physics, Delhi U
"An alarmist bias in Global Warming Research has corrupted the academic/scientific community"
Dr. Roy W. Spencer
Ph.D. Meteorology
University of Wisconsin-Madison.
Principal Research Scientist at UoA
Former Senior Scientist for Climate Studies at NASA’s Marshall Space Flight Center
"I have studied your paper during the weekend and I am impressed by your brilliant analysis and convincing argumentation. This looks like a very original thought process and one that does deserve broad dissemination."
B.Sc. (Hons) Mech. Eng.
DTU, Denmark
C.P. Eng. (Chartered Prof. Eng.)
Former Project Manager, CERN
Geneva, Switzerland
You will only receive quality content.
